A historical case for the DJI topping now, and what to do if it is.
In the last post we looked at different ways we can support the idea charting can be useful in forecasting large market moves and we looked at similarities between the “Roaring 20’s” rally and the rally over the last decade in the DJI. We left on a bit of a cliff-hanger: Was the March 2020 drop “The one”, or is something to come?
In this post we’re going to look specifically at the topping section of the DJI move and extrapolate that out into possible scenarios in the modern DJI.
We’ll do this by using a three stage compassion technique;
Zoning: Taking areas of approximately the same zone a move (Last 25%, for example).
Chunking: Splitting little price moves into easier to manage “Chunks”.
Relating: Look to see if we find patterns that’d seem predictable.
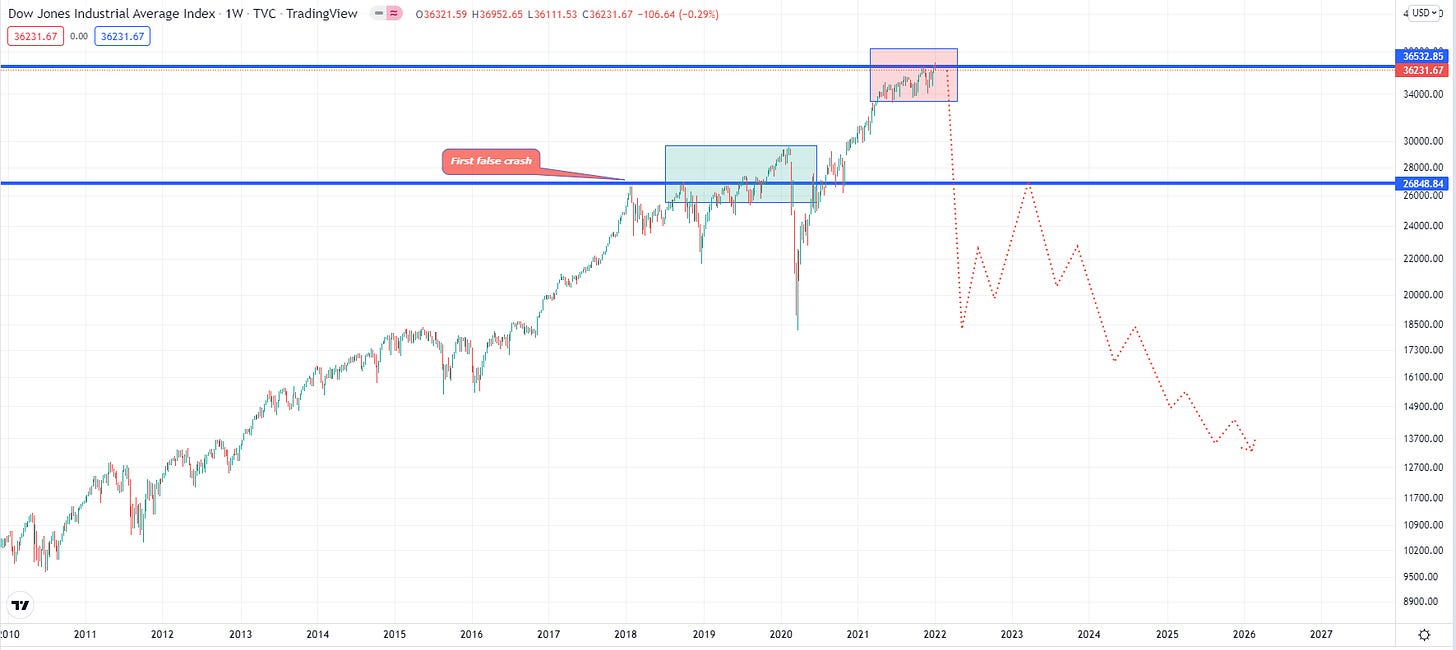
We’ll start light, to keep this friendly for people who do not have extensive experience in using the analysis methods used here. Here’s our first three important parts of the DJI high. We’re looking at a zone of the last 20 - 30%. Taking three main chunks of move:
The first false crash/loss of trend stability.
The range after this loss of stability.
Final move into the high and reversal.
And here this would be marked up on our DJI chart were we to assume the DJI high was in/being made soon.
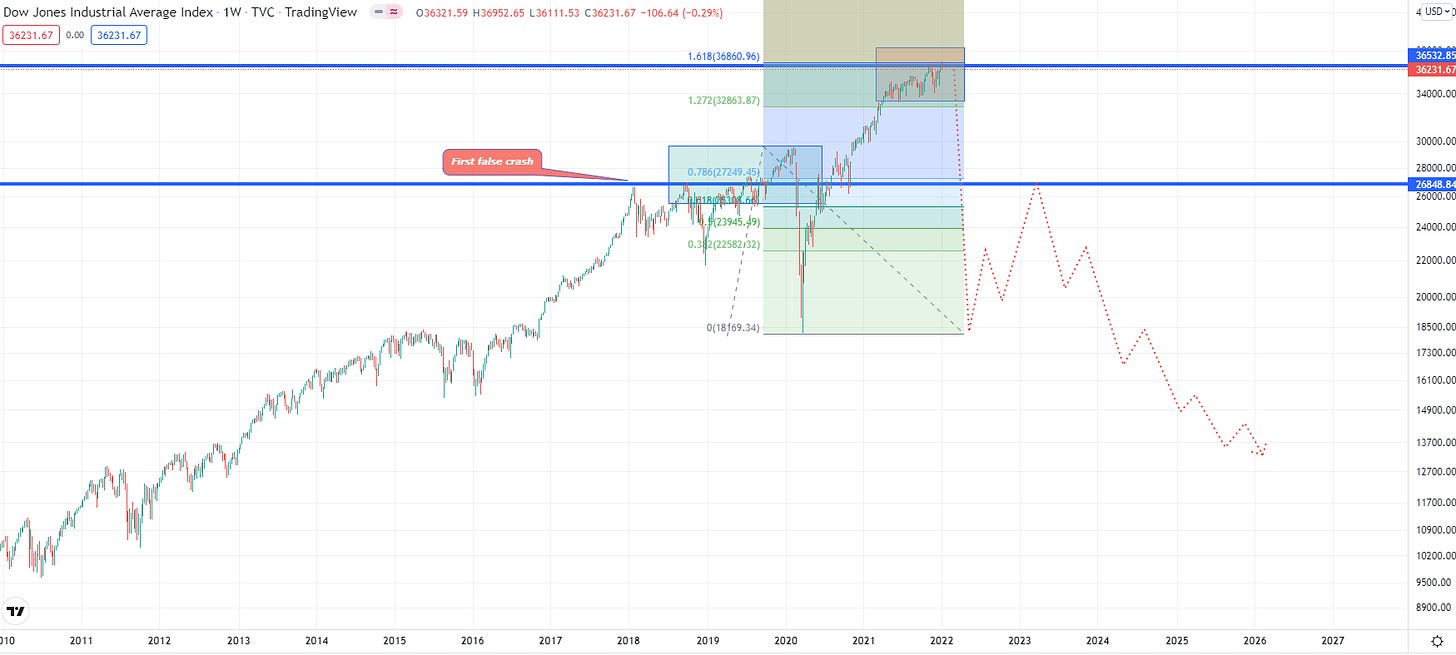
And to be clear about the implied risk here, here’s a projection of the other side of the chart pattern were we to be in a duplication of this move.
From here we’ll do a two step plan. First we’ll mark out the levels at which we’d be looking to see possible confirmation markers that this type of move is happening and then we’ll look at areas in which we would be able to make trading'/hedging decisions after the warning signs of the market breaking.
Let’s start with the relationships between the chunks. Does the green (range) chunk relate to the red (Topping) chunk? They do. It’s a 161 extension (And if you look into a lot of market highs, you’d expect it to be a 161 extension) - So that gives us a relationship marker. Will the DJI top off a 161 of the last range/drop?
Something I have wondered for a while and should not have long to find out from time of writing. The DJI has just hit this 161 level recently.
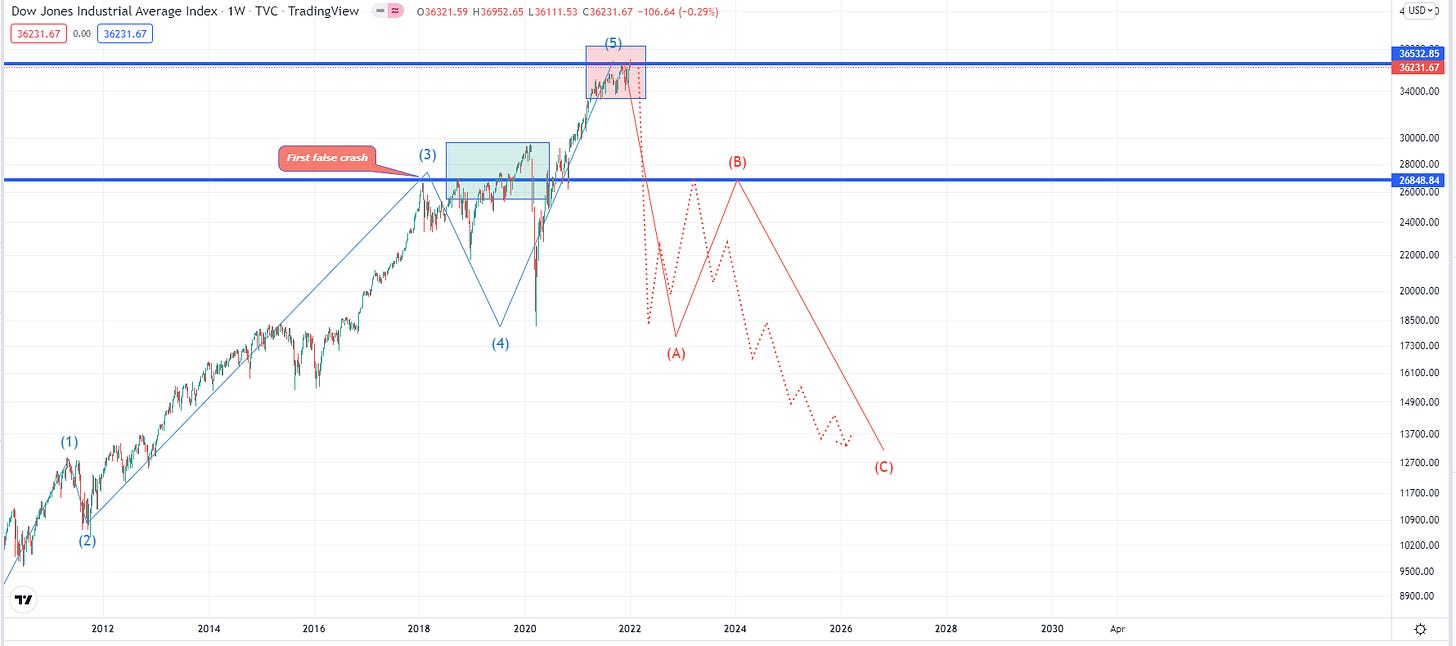
To relate what we’re doing here older trading models, what we’d be looking for here would be the wave 5 extension of an Elliot wave formation. With our first false crash section being the waves 3-4 highlighted and then the last top being the highlighted wave 5.
This Elliot model would have been very valuable in the 1929 crash. Picking out tops in real time is always a bit trickier but picking out the “B” point of the correction before the harder part of the crash would begin would have been very helpful. This retest coming in around the same place wave 3 ended was almost perfect.
But Elliot did devise his trend model in the wake of the Great Depression and this specific move would have been what he was looking at when he put together the model. So while we have a very strong example of a Elliot wave reversal here, it could be argued Elliot just copied this move to make the model.
But could it happen again?
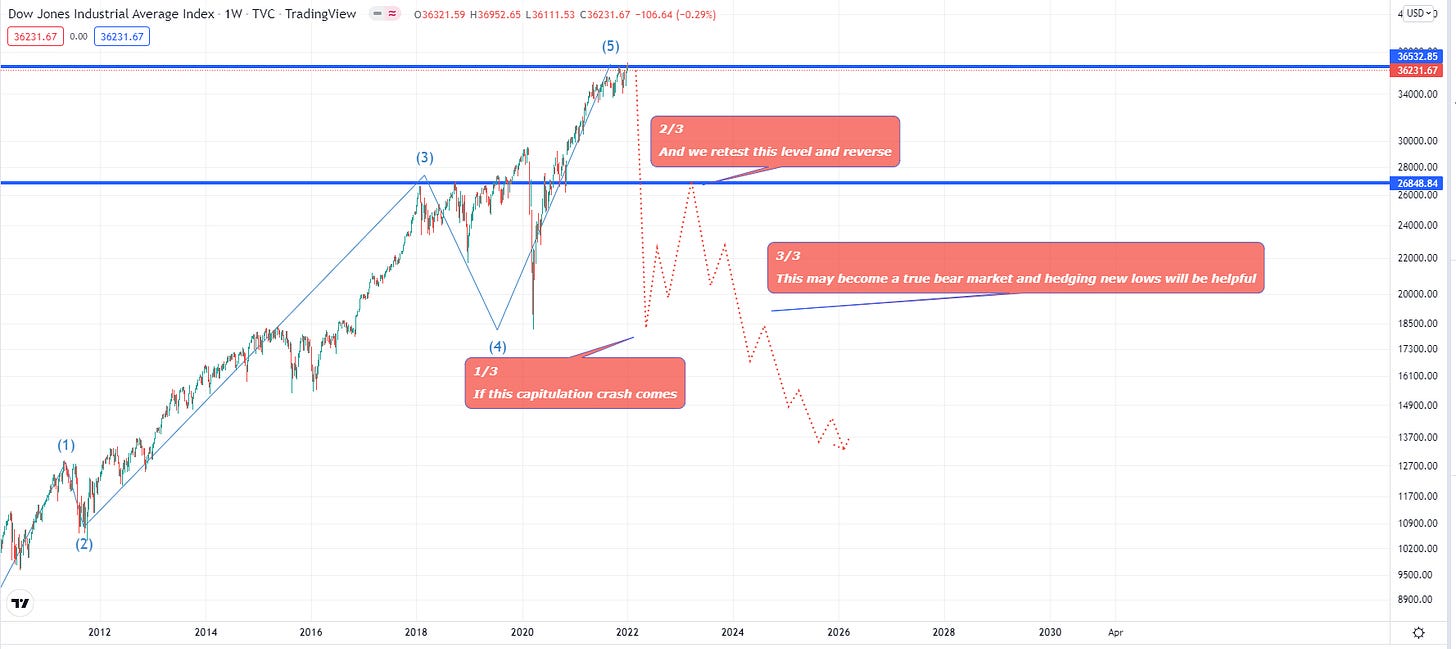
Further posts may go into more detail about different warning signs and trading strategies there were in the previous DJI high that may be useful in current times if there’s another crash, but for now we’ll leave this one with a three step plan of action in the event of a crash. This does not bet on a high, but plans in case it is.
Caveat/warning: Using strategies derived from the DJI crash of 1929 I was able to make accurate forecasts of the BTC drop from 60K to 30K during 2021. I’d go on to use the same rules to look to short a “B” point. Instead of this basic reversal pattern forming BTC spiked the high by a very very small amount and formed a butterfly pattern.
This threw off my trade plans for a small while. The previous move had been so consistent with the model I was using I strongly expected it to continue as such. After a brief period of losing basic TA strategies started to pick up winning trades again in BTC, but this butterfly type top is something to consider for SPX if swing 1 happens.
Putting that possibility on record now. Some people got really mad at me for being wrong on BTC for a about a month, and I myself wished I’d better prepared a contingency plan for a more complex topping pattern. So, if the 50% drop in SPX comes, do not assume the crash is confirmed - it might run the highs a little.
Such a move would be a trader’s dream and I’d imagine turn into an investor’s nightmare.


