A crash tends to break down to three main drops. We’ve previously explained the public perception we usually see during these stages. In this post we’ll look at how we can better define these stages, where the strongest bear move tends to be and how we can make estimates of where a low may finally be made after capitulation.
This also has some overlap with concepts explained in the posts linked for understanding the bear market rally.
A crash will typically break down to have three main drops.
To give these easy to remember/refer to names, we’ll call them (From high to low):
Fright
Terror
Panic
The “Fright” part is where the “Subtle pop” is forming, as per the Public Perceptions model.
From there we head into the “Terror” stage which is where there’s rug pull/capitulation, as per the Public Perceptions model.
Finally “Panic” comes into the washout low, as per the Public Perceptions model.
Looking at the rally into the SPX high of 2007, it’s fair to say someone could have mis-forecast the “Fright” stage many times.
Spotting the high of the fright stage and avoiding losses in that would be difficult. You’d have to know a lot about something, and that something be useful.
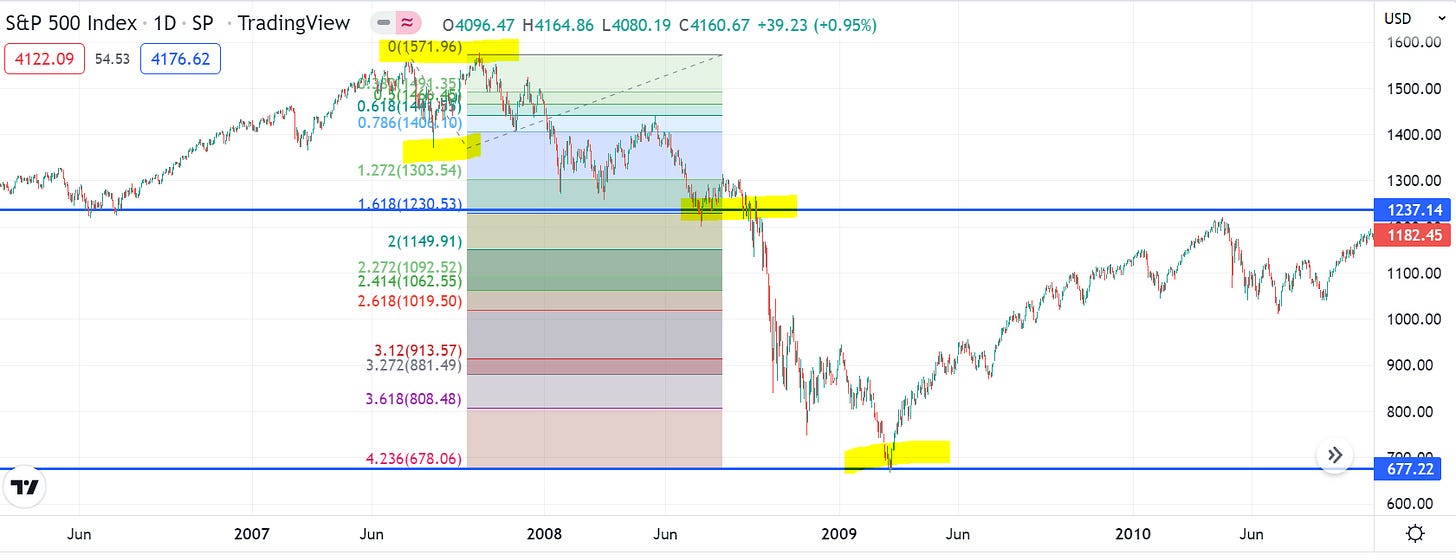
But the part of the crash that clearly does the damage is the “Terror” stage. The second fall where price picks up speed in selling. While it’d be possible to think the fright stage would turn into the terror stage multiple times, we can find signals that would have helped us to see the real warning break.
161 fib from topping swing
As these posts usually go, we’ll get into the fibs. Fibs are incredibly useful in downtrends. They’re good for tops, and now we’re going to look at them for middles and possible bottoms.
To get our fibs for this, we want to draw a swing from the high to the low of the topping swing. I’d encourage you to check this for yourself - I’m a stranger on the internet and I might be curve-fitting. Pull up the chart. Look for the clear last swing into the high. Draw a fib low to high. There’s only one way to do this.
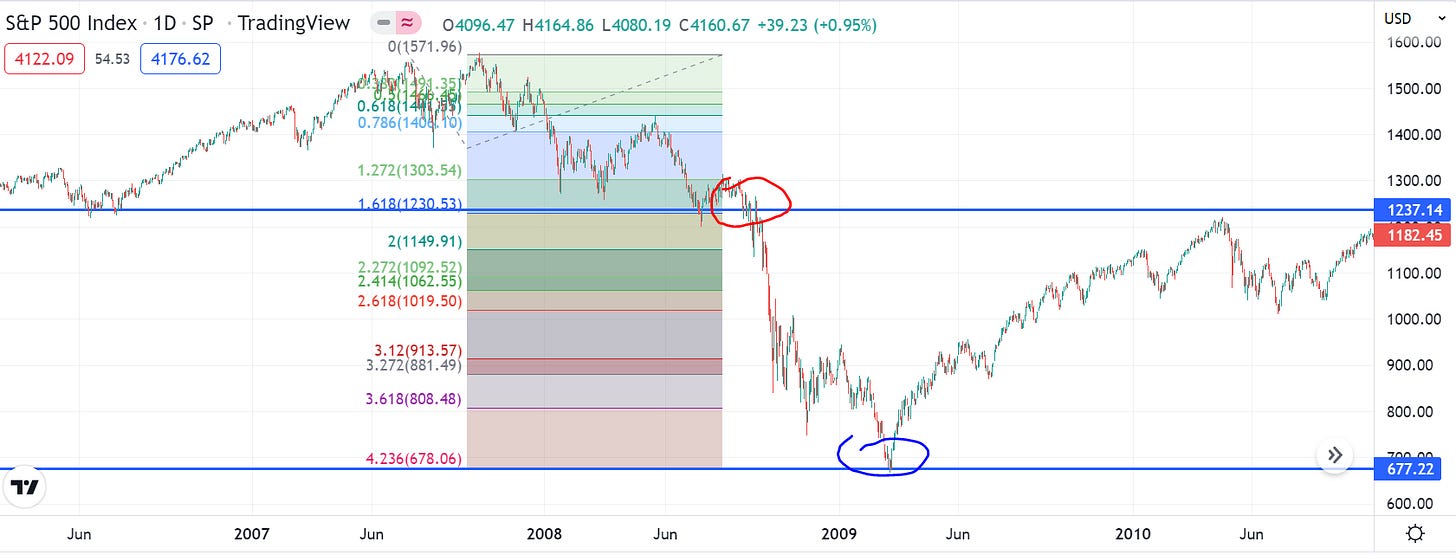
And when this 161 fib is broken, we’re clearly into the worst part of the crash. The difference in selling after the 161 break is clearly notable. Selling with continue overall until the 423 hit, and then this is the end of the crash. A drop before retaking the 161, but once we were above the 161 the bear market was well and truly over in the SPX.
The strategy of shorting on the 161 break and targeting the 423 fib trades here in the SPX crash.
It looks idealistic … Which is why I encourage you to check and see for yourself if you could have drawn this fib in real time if you had known about this possible signal.
In a big crash, once the 161 is broken the market usually declines 75% of what it was at the top of the bull trap.
Here’s a 161 break in PLTR last year. 161 hits, we bounce and once it is broken PLTR will go into the harder part of the crash.
For most people, this was the surprising part of the move. I’d have been more surprised if it did not happen.
Here’s the PLTR signal in real time.
We used this for so many trades during 2021 but it would take a long time to find and sou rce link them all. A great example of it was BTC, we used this multiple times in BTC to find break levels and targets.
Our targets for a 161 break have some variance to them, but they are always one of the next fibs. A crash will usually stop on the 220 fib, 261 fib or follow all the way through the 423 fib. These are levels we can look for short targets, possible reversals and stop losses/new short entries into breaks.
Assuming we are heading into strong stock moves, time for explaining theory at this point is somewhat limited. Price waits for no man and those behind this content are full time traders with their own trade plans to generate/execute and also work to be done for clients, and a lot of new client/services requests have come in lately.
Time for extensive theory stuff has passed if this is happening, but we’ve prepared for this a long time and have a series of things we made early for when we got to this point. Here’s a bunch of 161 break examples that were done back in Feb 2020 (Where we hit the 30% drop but incorrectly shorted into the ‘retracement’, see more).
Silver - 2011.
Gold - 2012
BTC - 2017
AUDJPY - 1996
DJI - 2001
DJI - 1930 (The OG).
There are differences in the way the breaks and bull traps form, but whenever we’re heading through one of these big 161 levels and breaking them - the crash tends to get much, much worse. Spotting this break helps for a timely exit before the real smash part of the move begins, and the speculator should see the advantages of this tendency.
For the purposes of being fair and objective, this signal failed in 2020. It was very good for telling us where to expect a low. However, trading the retracements for a second break here evidently did not work out. It should be noted a 161 hold here has been a strong historic bottoming signal. 161’s are major decision levels.
On to today
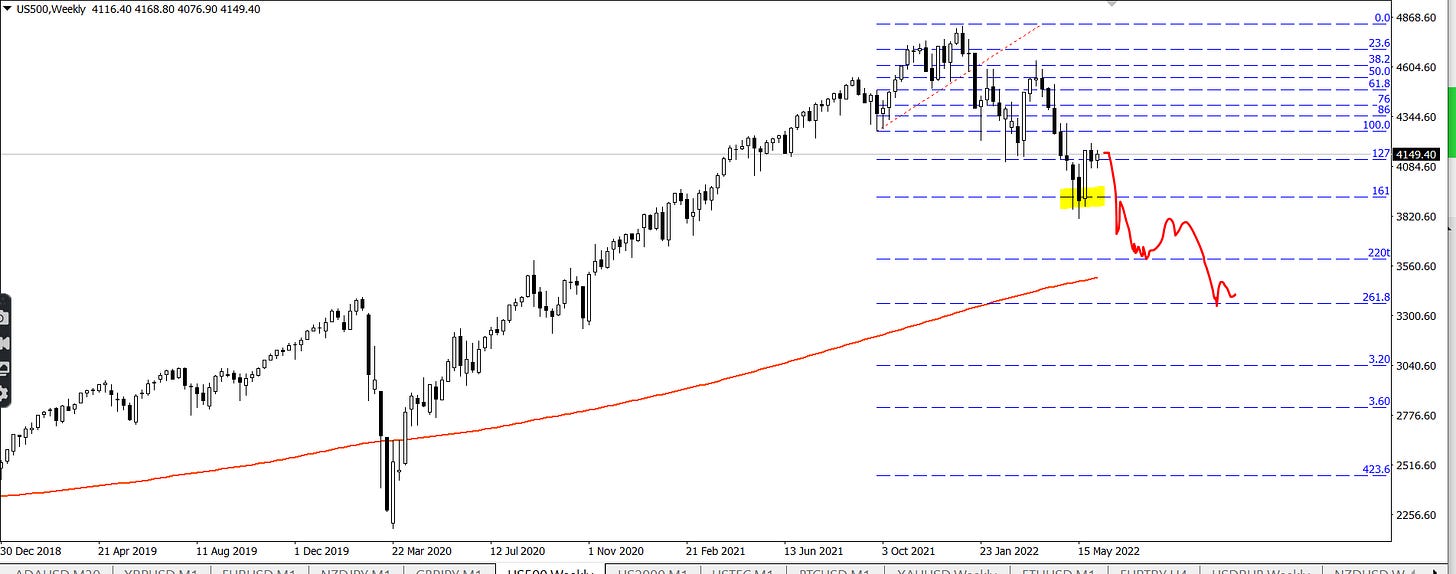
We’re putting this out today because over the last weeks SPX has tested the big 161 of its topping swing and is currently in a bounce from it. While there’s variance in bull traps and we need to be aware this can be a tricky part of a drop to navigate - our breakout trade here is clear, and we’re positioning into the rally speculating it comes.
This is a pretty big trade but this type of move would not warrant the amount of time and effort this crash forecast/warning and offering of trading strategies has taken (We’ve worked on this for years) - What is concerning about this is, if this move happens, a bigger 161 break becomes actionable.
And this one would matter! This one would affect people’s lives.
At this point, we’re putting the possible 161 break at the SPX price of 3900 on your radar. We think this will be a good trade and is a current risk to bulls. The ultimate aim of this is to test the idea/provide supporting evidence for reference later if it comes the time to start warning about the bigger 161 break.
We’d be expecting to be most active in putting out this warning somewhere around this time.
Which would be a point I’d imagine there’d be quite a bit of bullish sentiment. Also, a lot of bears loudly mis-calling a crash from the low.
This post is to help to establish some practical utility in this strategy should a break set up. We’re saying the market should go into a more obvious drop under the 161 and make what seems like a miraculous low on the following fibs - And if these things happen, the next rally is extremely risky.
We’ll update when the conditions fill or the risk factors for this are invalidated.


