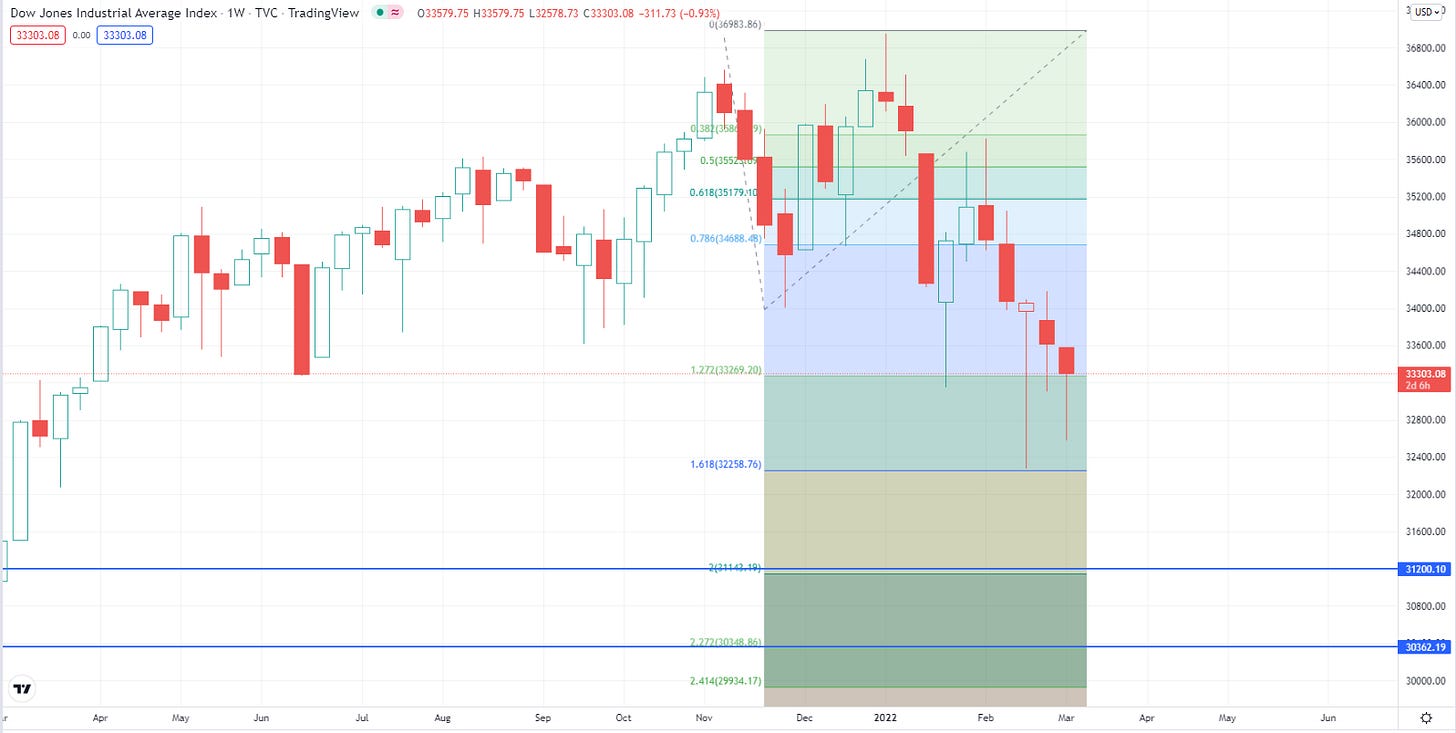
See part one for original DJI analysis.
Modelling the 1929 DJI crash to today (substack.com)
In part one we defined our warning steps to look for:
The move has been a bit slower (It should be considered that there’s a lot of reasons to expect markets to move slower now than in 1929 - even if following the same basic move) but has a lot of the same general form.
We have our immediate bounce and we have the low break. It looks like we might be setting up a second low break.
In the DJI of 1929 the most efficient forward looking targeting analysis would have been to draw a fib from the low to high of the topping swing and target the 200 and 220 fib levels. This is where the first big bounce came.
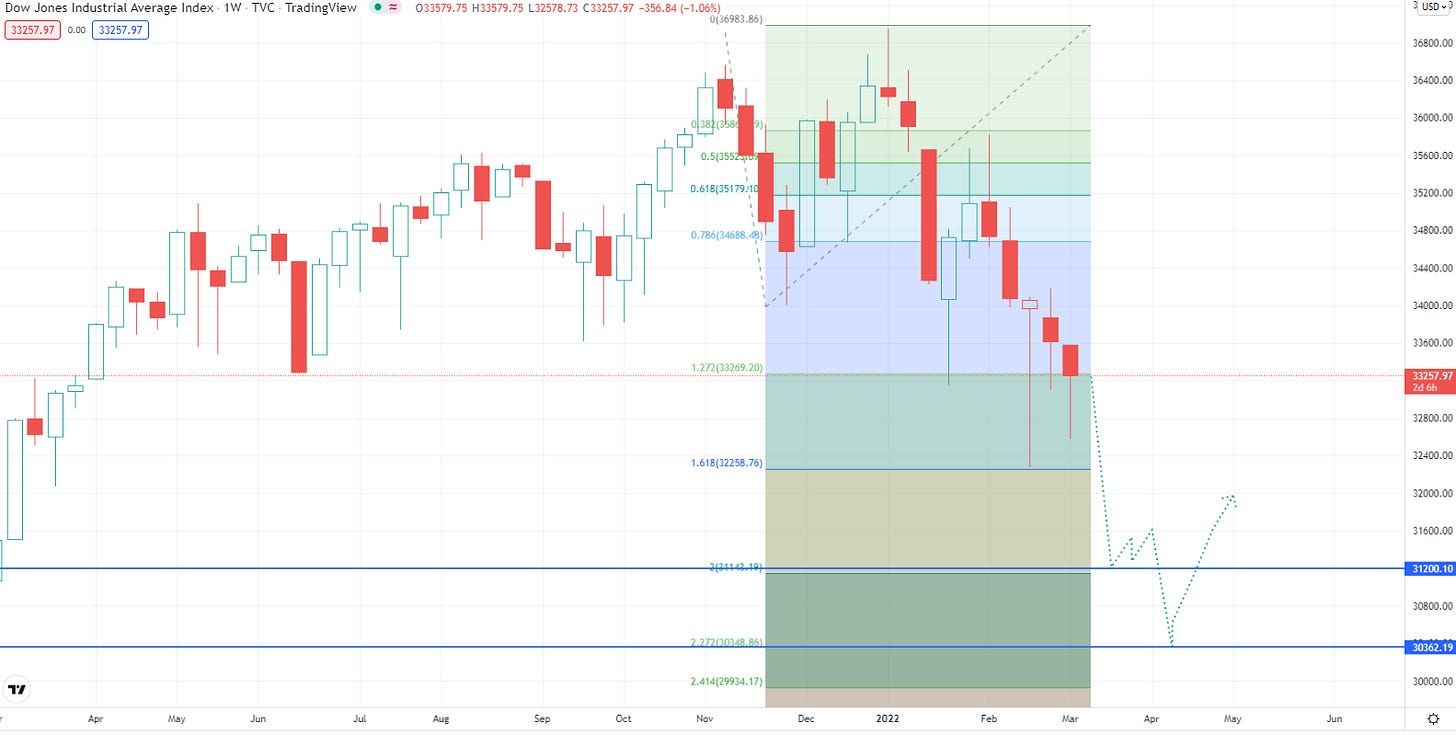
Here’s the modern day extrapolation of this:
Here’s the implied price swings. This would be a good spot for hedging positions if long or speculating short with stop losses above the last big swing high.
Targets on shorts 31,200 and 30,400 on the DJI.
More detailed plans along with some individual stock plans will be sent out to our members newsletter.


