In this one we’re going to do something a little different. Rather than looking just at the indices relative to previous big trend failures, we’re going to under the hood and look at some of the biggest and important stocks in these indices and look where they are relative to classic trend continuation/break levels
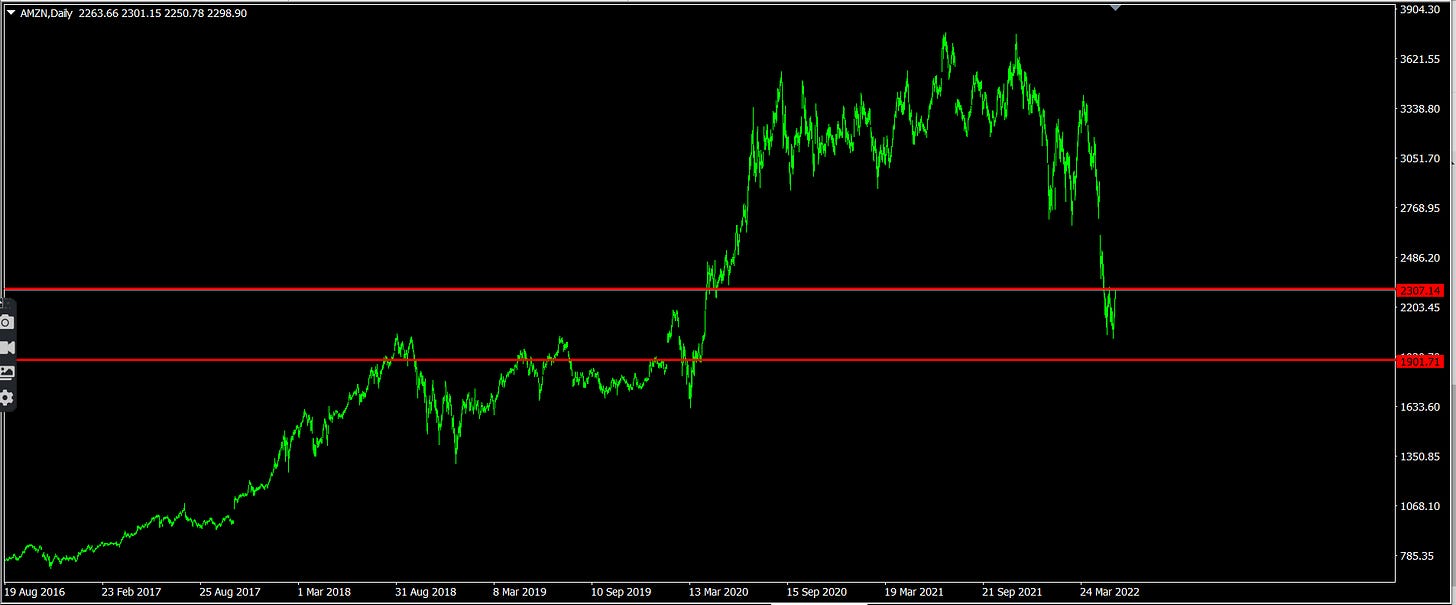
AMZN
All critical AMZN levels come in around 2300 - 1900. Most of these currently put us just under the expected support level. Further declines in AMZN may be the first real signs of macro bull failure.
Track these levels on TradingView.
AAPL
All critical AAPL zones put the big inflection point around 139.
Track these levels on TradingView.
TSLA
All critical inflection points in TSLA come in around 707. This may already be a successfully broken support level.
Track these levels on TradingView.
MSFT
Most critical levels for MSFT come in around 297. This is an area that has already been well broken. We’ve probably exceeded the expected spike-out tolerance for this already - MSFT looking like the most obvious break so far.
Track these levels on TradingView.
GOOG
Most of the big inflection points for GOOG come in around 2280 - 2380. This is an area that looks like it has been successfully broken.
Track these levels on TradingView.


These targets look possible. See analysis for similar sized drop in SPX https://holeyprofitnewsletter.substack.com/p/3350-is-first-big-spx-short-target