

The Japan Miracle Break
A look at the price action immediately before the Japan depression began

Japan used to be the mega bull of the world. Did you know that? I never. Until I started to research booms/busts, I’d never thought about a Japan bull. And, I’d dare to speculate, this is also the case for most people under 40 who do not have a specific interest in stock market’s history.
From 1984 to 1990, Japan did this!

It was called the “Miracle Economy”. Setting a new standard for growth worldwide. Businessmen from all the top companies went to Japan to study. Japan was a very big and important thing. And today, who knows? In the last 30 years, there’s been very little talk of the great Japan bull.
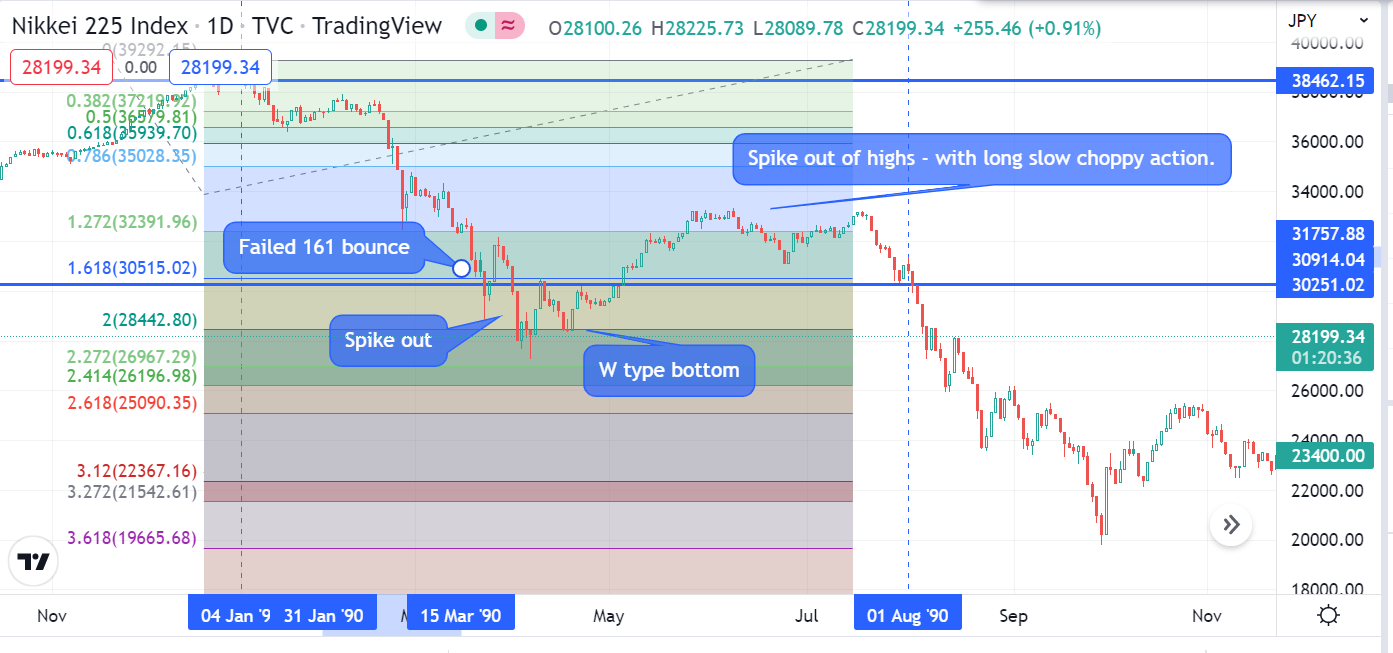
And that’s because after making a high on the last day of 1989, Japan’s index did this.

Today, this period of the up is referred to as the “Bubble Economy”. Funny how that works. It would turn out the “Miracle” was just the central bank (BoJ) having low interest rates and easy access to money. Much of this found it’s way into the markets. A speculative boom was created. Once the BoJ stopped that, down it went.
And that was that! If you want to learn more about the Japan boom and bust you can Google/YouTube it. You’ll be able to learn about it from smarter and more informed people than I. I’m going to get on the fibs. I watched a lot of videos, read loads of articles, skimmed many more pages and PDFs - I didn’t see a single fib!
Which is sad, because they were interesting.
In the interests of transparency and objectivity, the 161 top strategy failed with Japan. I won’t go through the failures here, but Japan was a move in which to learn about failed 161 patterns and protecting against them. It really did not comply with the signal rules.
But when we get into the 161 break/capitulation signal, this was a much better signal. Trading in real time we’d probably have lost a few 161 signals here, probably be incorrectly long a few times during the initial decline - but our 161 rules would have been very useful in telling us a real break was in effect.

Uncanny. There’s only one way to draw this big topping swing. It went through it. Triggered the breakout warning. Made a bull trap and then into a clear and sustained crash upon breaking under it a second time. Once we’d seen the 161 breaking here, we’d have known to be interested in short opportunities into a rally.
Let’s apply the concept of chunking to this. Read the below post for context on “Chunking” if you’ve not read them already.
Four main things happen here, and they’re all things you’d expect to see if you were trading these 161 breakouts today in various different assets on smaller timeframes (These happen intra-day all the time). Here’s the four main steps. These are common to the pattern and also clearly identifiable “Markers”.
Left to right:
161 tries to hold. Makes a dead-cat bounce and goes into another sell.
This sell is strong but ends at next fib.
A double bottom like structure forms, making a “W”.
Sharp rally. False breakout. Frustrating range.
And then the market breaks.
Four things. Pretty specific. Very specifically at the 161 fib of that topping swing. What do you think the odds are I could find anything even vaguely similar in the current SPX off the 161 fib? Slim, right? Need to do a lot of fitting and fluffing to pull that one off …
Or not.

Fairly simple stuff to complete the matching PA for that.
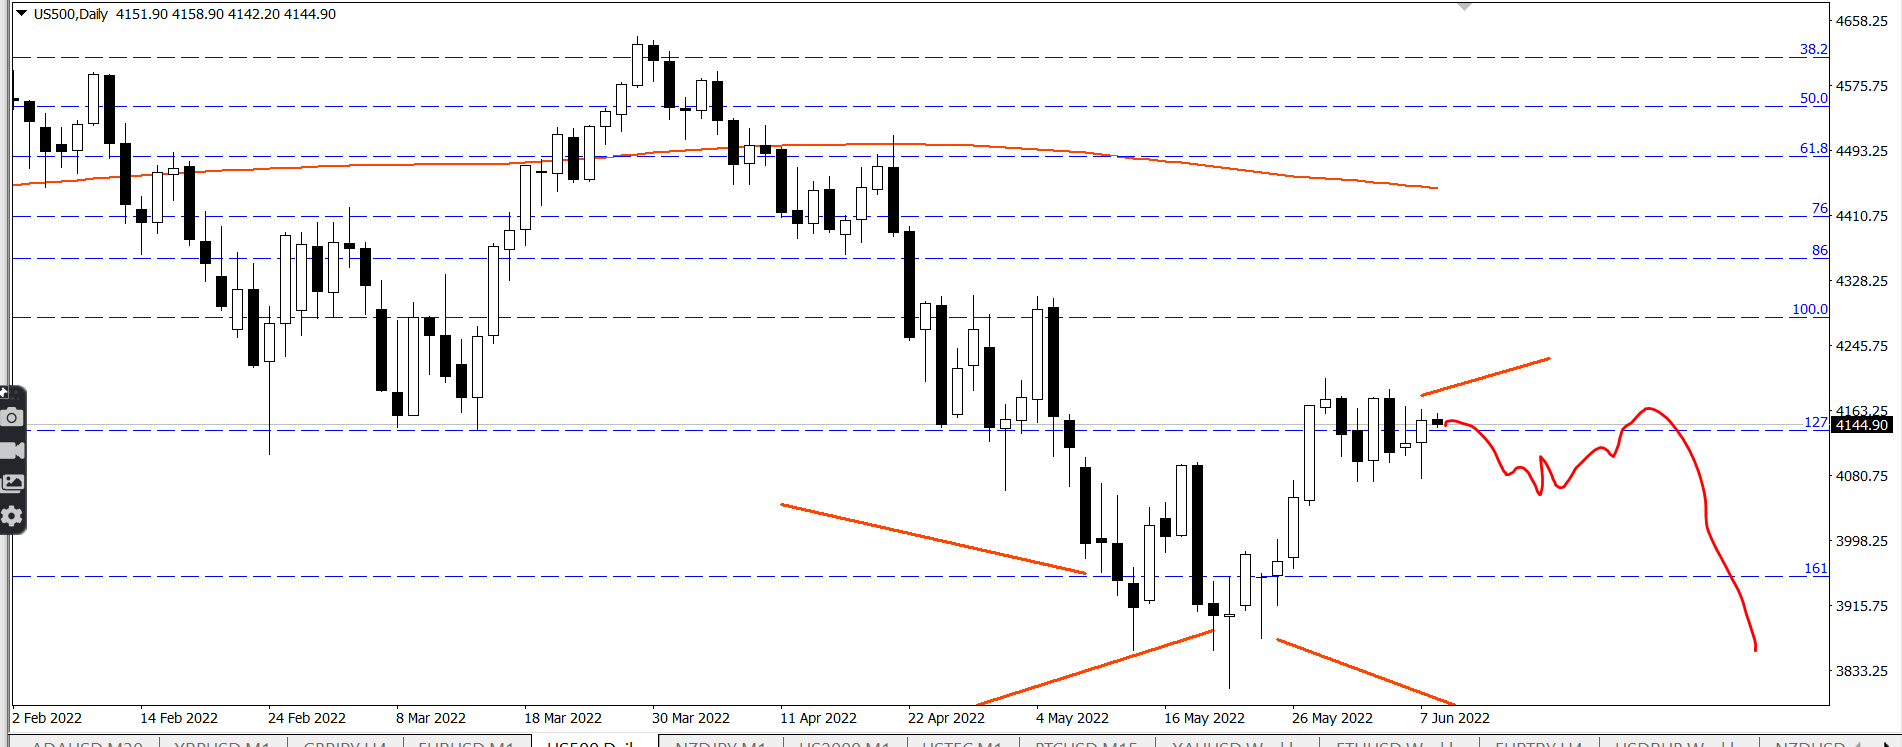

These are “Significantly similar”, right? I look at a lot of charts and have “Things” I am looking for, but I think even to a causal bystander these would have to be said to have significant similarities. We’ve hit all four markers and it’s happened in a specific area. Japan also went specifically just over the 127 fib, we’re there now.
If you look at the Japan break, if you’d set out with a thesis the 161 break was important and then designed some entry and exit rules for trades if that break was made, you’d have nailed this trade. It was, literally, easy. If you take out all other considerations you may have had at the time - execution on this was easy.
Once your break is signalled - pretty much everything short works. Were you prepared to short into the rally off the 161, you’d have entered right before the second part of the crash would kick into full effect. I know everything is perfect in theory, but I look for where I’d have made real mistakes too - And Japan was a “Gimmi”. Easy trade.

And SPX would be too, were the weird to become the surreal.
For the speculator:
Japan break and downtrend without big bounce was good to about 360 fib. 320 target here would have gotten you a lot of value out the move and you’d get out before it started to get more bouncy. This would have been a good short exit. Other entries would come later.
For the investor:
Japan got bad. More than 30 years later Japan has made no new high and is currently about 50% off the all time high.
This is only a section of the Japan crash.

When the Japan bubble popped, people were very surprised. Japan was a miracle. It could never end. Something as minor as monetary policy could not stop this run-away bull. Everyone was in the market. No-one was selling. If you’d sold into any of the previous drops in the Japan market in the last 8 years, you were a sucker.
But there was little surprise in the chart. We seen a new version of an old thing.

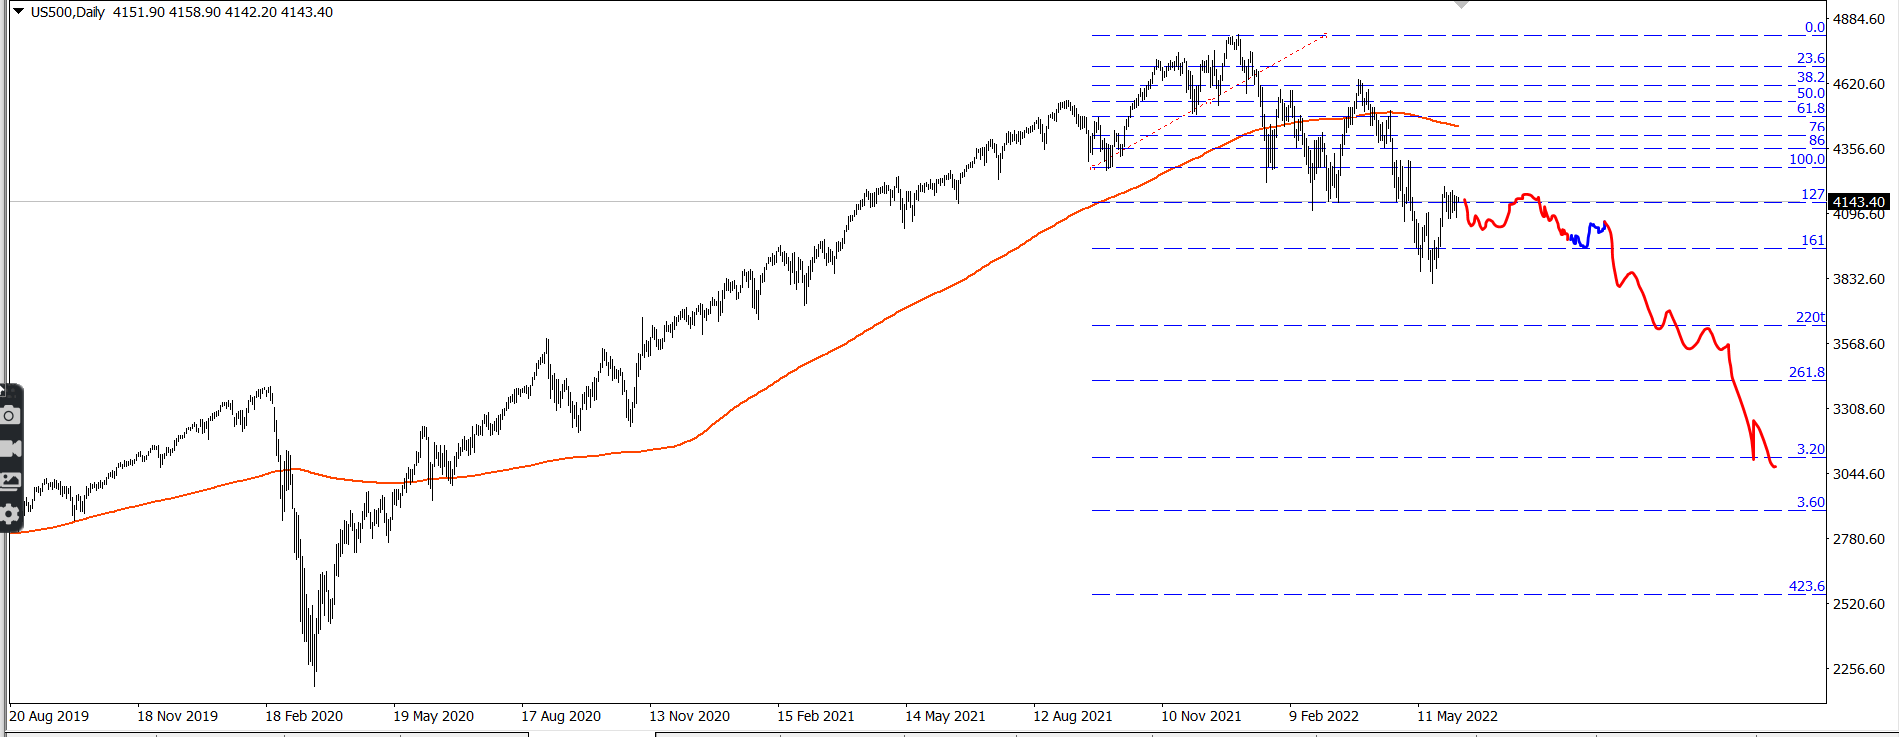
We’re not being dramatic when we talk about capitulation risk if we see failings of the big 161s in US indices. That is exactly how a lot of crashes go from one gear to another, upon the breaking of a big 161 from the topping swing. Almost invariably, this is also where the news cycle turns persistently bearish.
I’m pointing out these things to you for the first time. Try to imagine you were aware of these things a few years ago. Aware and interested. Looking to see what was happening in current markets relative to this. For the whole time, you’d have “Known” news should turn bearish into 161 break - then hard downtrend starts.
These are “Knowns”. If you were into this idea and went to try to prove it wrong against historic crashes by the time you were finished you’d decide it’s correct. These can be classed as “Known traits” if you go through the checking work. You’d expect to have bearish stuff happening around the 161 of a topping swing.
Were you to assume the US may be in some sort of Japan like boom, that will end with the Fed reversing their interest rate policies, this would suggest to you the downtrend would be started around this specific area and also based upon changes to monetary policy.
All these charts are very old … Anyone who went through this stuff really would be able to mark out this criteria a long time ago. What are the odds you’d actually see it?
Where’s all this happening? If you draw a fib from the high to the low of the 2000 - 2008 crash range, into the end of last year we hit the 423 fib.

Interesting thing, because that’s never happened before. Not in my lifetime. We hit the 423 extension of two 50% drops. The only other time US markets have done that, was 1929. This is the only times there’s been two 50% crashes spaced a few years apart that went into a decade rally.

Were you to have known that - you’d have wondered for years if something interesting may happened here. From that perspective, isn’t this all rather peculiar?
The warning break was made. Waterfall to 3300 may now follow. https://holeyprofitnewsletter.substack.com/p/big-waterfall-event-may-come