Summary
SPX breaking 3900 may be fatal to the bull market.
US indices may be due multiple year bears.
We're talking worse than 2008.
See original Big US Bubble forecast on TradingView.
This piece is going to bring together past pieces of work and then go on to make future forecasts. The early part of this will be framing why we think these models are useful, showing real previous results and answering the common questions/objections we’d expect. If you’re a follower of our work, you can skip to line-breaks.
The Onset of the Macro US Bear
In this article I'm going to present the case for the structure of large market trends fitting into an approximate model in which the booms and busts are "Somewhat predictable". Or, at least we can spot recurring tendencies and be alert to them if we see them.
I'm not talking about 10% pull-backs here. What I'm going to present is cases where a trend develops over multiple decades and then has a full correction of that. When this happens in indices, this is called a "Depression". We're looking at drops of at least 75% off the high, typically taking over 5 years.
And I know this all sounds very far fetched and fanciful. TA in general has a lot of sceptics and what I am proposing is not only TA based but it's also assuming TA can forecast moves that will have to happen due to real fundamental events. Market crashes happen with "Things".
So - Before we go into that let me present you with a series of extremely unlikely seeming forecasts that have turned out to be very accurate so far in this drop of the last 6 months in US indices. All of these were derived from the studying and modelling of previous large asset crashes.
Dec 2021 Short DJI as it hits the 161 of March for TVC:DJI by holeyprofit — TradingView
In December the DJI topped exactly on the 1.61 fib extension of the March 2020 drop. This has been a classic recurring topping signal through major asset crashes.
-
Feb 2022 - SPX at 423 extension of 2000/2008 for SP:SPX by holeyprofit — TradingView
SPX reaches the 4.23 extension of the 2000 - 2008 crashes. For the first time in 90 years, a US market extends 4.23 of a 50% crash. The last time was the 1929 high. Deep dive into similar crashes in different times.
-
June 2022 SPX retesting the 161 of March 2020 after a break for SP:SPX by holeyprofit — TradingView
SPX retest the 1.61 fib of March 2020 drop. It's previously traded to the 2.0 extension and this is the December high. A forecast of possible strong bear move if this level (Price 4150) is broken. Again, 1.61 rejection is classic recurring topping signal through major asset crashes.
Quite interesting, right? And, look - I'm cherry-picking. You can look through the TradingView and see times I've been right and wrong. Often there's a difference between functional trade plans and use of models for forecasting. Risk:reward etc has to be considered, but these were clear signals as per the fib norms of crashes which appeared only once!
In December I set up this SubStack called "Beat The Bear" and started to explain my warning of why a major crash may be due to start. The SubStack was set up one or two days before the high was made (And again, I'm not saying I got everything perfect. I tried shorts before. But at this point we were hitting all the levels where either these things would succeed or fail.
We need about 20-25% grace period for spike-outs into highs and we were right at the end of that. In December it was sink or swim time for the models. I started to put more effort into putting together a structured explanation. In December I made various forecasts of what "Should" happen and then waited to see what did happen. And then things got interesting.
I think through the work done on the SubStack with real time forecasts of exceptionally unlikely seeming events with only tiny amounts of variance to the forecast makes a good case for the efficacy of these models. For them having real foresight into current markets.
Supporting posts:
Modelling the 1929 DJI crash to today
Modelling DJI of 1929 to Today: Part 2
I believe at this point we've done sufficient forecasting of impossible seeming events and documented these well enough to lend some credence to the idea that's presenting this case is not foolish. And I did wonder, because while it all checked out in theory that historic crashes could road-map future ones; it seems unlikely. The internet also told me so.
At this point we've demonstrated a hit rate on major swings that is far beyond what one would expect from chance. Given that, it would seem irrational to not consider the risk of these models continuing to develop and reaching their full, grim, implied ending.
Soo ... now that I've tried to frame it a bit - We're going to look at how the finding of commonalities and recurring themes in the DJI crash of 1929 and the Nikkei of 1990 would imply, and give us a road-map for, a sustained bear market of not less than 5 years and -70% in SPX.
With the high having been made in December of 2021. We'd now be 6 months into the reversal from macro bull market to macro bear market - And this would soon be about to become a lot more obvious. We'll also include our forward looking testable markers for if this is happening/failing.
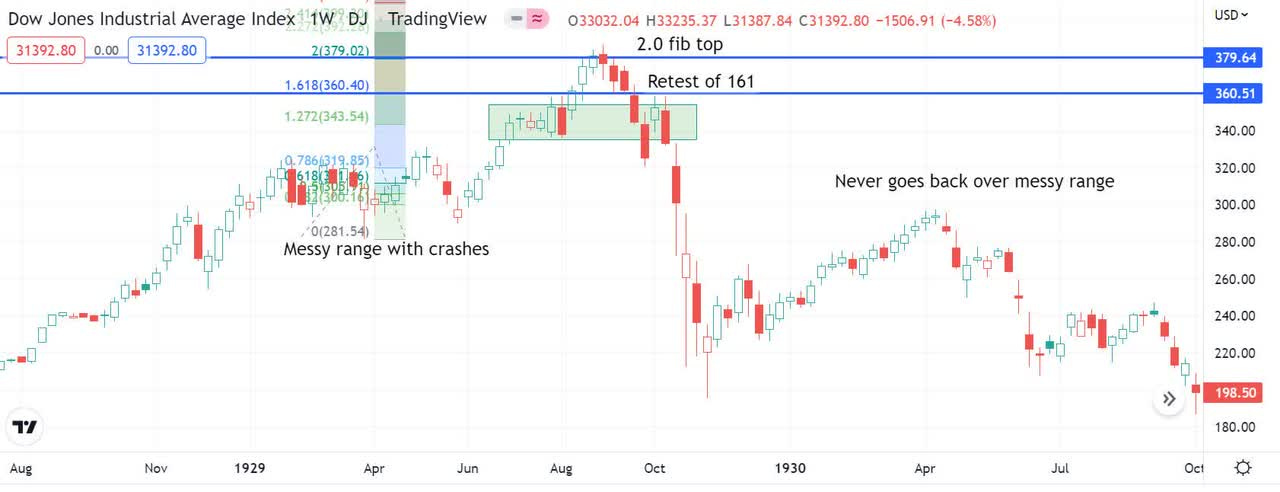
DJI high of 1929 and 2022
If you’re thinking it makes no sense to model DJI of 1929 to today because of the host of reasons that spring to mind, see Different ages with similar crashes.
We'll start simple. This is a "Spot the difference" type of thing. One in which I'd expect people without any charting literacy to still be able to see we're looking at things notably similar. I'd propose any objective person could not agree these are "More similar than you'd expect".
DJI of 1929
SPX of 2022
This was originally posted on Twitter in June of 2022. We try to always post things in places where they will be timestamped, can not be edited (Or edits are noted) and are obviously platforms we have no admin control over. To be sure everyone knows these were real time forecasts.
Based upon the DJI model here (And common norms of tops) it was clearly stated a year before we got to the high that the failure price for the strategy would be 5,000. The 2.20 fib should not break. Most instances of breaks of this lead to trend continuation. Most crashes reject the 1.61 - 2.20 zone.
Originally posted on Reddit. Mid 2021.
Was a bit early on indices, but not by much. You can read a series of newbie friendly posts I did for r/WallStreetBets during 2021. For forward looking strategy tested we cover AMC forecasting a crash from 60 and also forecasting the start of a bear in ARKK. Both of these transpired.
So, not "Perma-bearing" and not "Right eventually". It's proposed all the big inflection points in markets can be determined months and years before the fact with about 20 - 25% grace for spike-outs. I want to be clear on that. Bears are easily dismissed with cliches, they do not apply.
This may also be wrong. But it's a lot of strange stuff all coming together and if the market will make a "Model crash" I think people deserve to know!
If these things happen, they should be documented and recorded so people can see it after. If I tell you about the fibs the day after the market crashes, it's fitting with hindsight - we'll tell people before anything is expected to happen (And get called names until they do/if they don't It's kinda a given).
Worse than 2008!
If what I am putting forward is right, 2008 will be demoted to a footnote in history. I did a long-from version of this on LinkedIn.
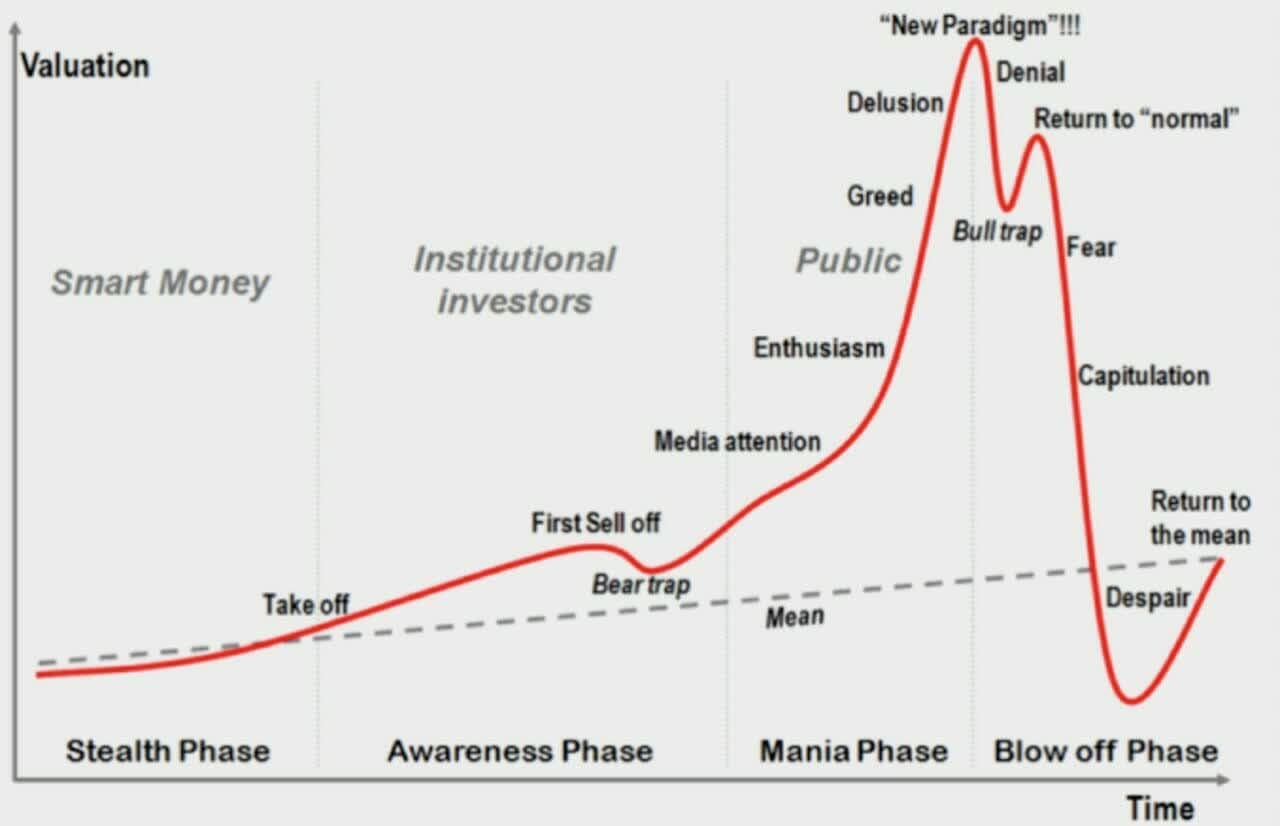
In this one we'll just look at the models. There's this. Everyone knows this. If you didn't know this, you'd have seen this in 2022!
I made one.
The big US bubble. for SP:SPX by holeyprofit — TradingView
If the model I am putting forward comes into effect, 2008 will have been the "Bear trap" section. Let me be clear and specific here - if this is the case the real bust will come down under 2008. The real crash always comes down under the bear trap in this model.
Here's the DJI of 1929. In 1915 and 1920 there were two major 50% crashes (1920 was called the "Great Depression" until 1929 happened). And the drop came back under this.
We posted a like for like on this while the market was ripping into ATHs every day.
Even if we were to just assume the first leg of this crash would happen, that would take us to under the 2020 lows. A 50% drop off the high.
Short DJI as it hits the 161 of March for TVC:DJI by holeyprofit — TradingView
Which we have a SPX forecast out on also. We're making real trade plans and trades for this move now. News based 50% drop in SPX for SP:SPX by holeyprofit — TradingView
Critical warning signs
Now we're going to put forward markers we should see if the market is going to make one of these huge crashes.
We've laid out extensive markers during December and Q1 of 2022. These are not subject to change (Although some tolerance for slight model variance in spike-outs is required). These are more detailed and they were written before the market made breaks, which I think makes them more interesting.
Modelling the 1929 DJI crash to today
Modelling DJI of 1929 to Today: Part 2
Here's a simple marker. One where you can draw a couple lines on a chart. Put that to one side and only think about it again if you see these things becoming real in the future. Something that's easily digestible and objectively testable.
The hypothesis is, big market crashes start once a 1.61 fib of the topping swing has been broken. This is a capitulation signal that can be found in almost all crashes. We're going to mark up the fibs for this. Give the actionable break levels and our estimate of price action around them.
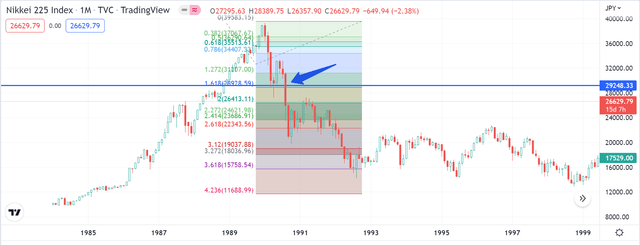
First - We'll look at the DJI and Niekki to give some context. Because otherwise it looks like we're scribbling lines, when we're actually trying to be quite specific.
DJI 1929
Drawing a fib from the low to the high of the last parabolic move, the market goes into a clear crash on the breaking of this. This is also where the big bull trap rally will stop and the second crash will begin as the 1930s get worse and worse.
I hope there's no argument. If for any reason you had drawn this fib (And there's only one way to do it. One topping swing and it has one high and one low), understanding a warning signal was appearing on the breaking of it would have been pretty useful.
If you'd been aware of this tendency (And it is a tendency, go check other crashes) it'd have been really helpful for Japan's bear break also.
Deep dive on the TA directly before the Japan break.
If one was to have this drawn in on the SPX you'd have been looking for a support at 3900 and a big warning sign if that broke. This is a signal you'd be able to define before the fact and you'd also be able to add in "Should be a super strong break".
And here's that swing.
Here's the before the fact warning (Posted right into a face ripping rally).
I think if bulls give up 3900 / 3800 trend has failed. for SP:SPX by holeyprofit — TradingView
And here's today's warning. If SPX continues strongly through this level and the following bounce holds a lower high inside of the fib structure - the models (That'll we have been essentially 1:1 for to this point) will then imply we break the March 2020 low. In strong down trending style.
If a depression style crash is then to form, the SPX will hold the retest of the 3500 - 3700 sort of zone. Reject this and downtrend for years. To be explicit in what I am saying is forecast here, SPX will not trade above 4,000 any time in the next 5 years. Can be over 30 years for recovery in these busts.
We'd be heading into the fast crash section of a bear. And later would come the grinding downtrend section. Trader holeyprofit — Trading Ideas & Charts — TradingView
Failing to protect a portfolio from this would cause extreme risk of ruin. Buying the dip/rally after 50% drop would be disastrous.
I'll leave you with this. The famous mis-forecasting of a forever bull made by Irvin Fisher right before the big DJI break of 1929. Listen to what the man says. The percentages he uses. The "Safe" and "Risky" ways of being in the market. Listen to what the man says.
You'd only have to edit tiny little bits to make it fit the narrative perma-bulls have at this very moment in time.
Irvin Fisher was wrong. The market was not infallible. Easy monetary policies and a speculative boom made it go up, and this all came down very quickly when that was reversed. It'd repeat in Japan. Last day of 1989 was the Japan high. Early 1990 the BoJ reversed their economic policies.
I don't think I have to spell out where I am going with that one.
Do not underestimate risks based on recency bias.
While it is nice to hope for the best, it's the worst that ruins you. Consider the worst possible outcomes. Use these to inform your current risk decisions.
People seem to benchmark the worst possible outcome as a 2008. 50% crash, few years to recover. But 2008 may be an event few people know of in the future. In 1929 people would have assumed 1920 was their risk. 50% crash, few years to recover. And that was not so. It was very much worse.
If correct, the crash has started.
Were these models to be correct the market would have made the bear break that confirms the long-term bear market on the 13th of June 2022. When breaking the 3900 price level in SPX. From here we would set a general tone of lower highs, perhaps with a capitulation event happening soon.
Here’s are post from the 12th and 13th of June 2022. Currently the market has acted in ways consistent with these (Ominous) forecasts being correct.


